

According to the TREB market watch report homes sales across the GTA are on the rise over the summer months this year. In fact the MLS® Home Price Index Composite Benchmark was up by 19.1 per cent year-over-year in September 2021. While the average selling price for all home types combined was up by 18.3 per cent year-over-year to $1,136,280. Even so a general lack of new listings and low inventory has resulted in lower sales volume (-18%) over September 2020. Scott Brubacher Broker here with Royal LePage Meadowtowne Realty with the Mississauga House Price Report October 2021
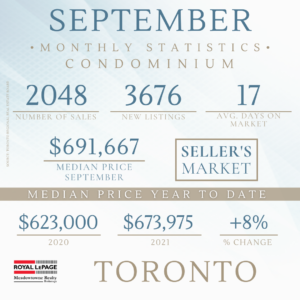
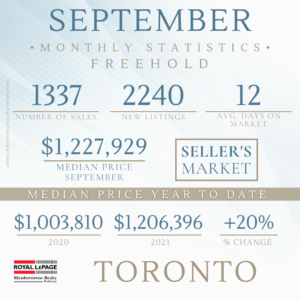
Mississauga it’s a sellers market
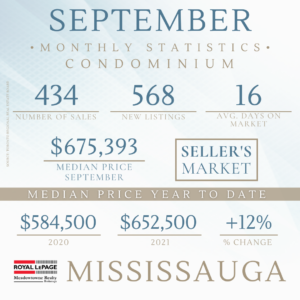
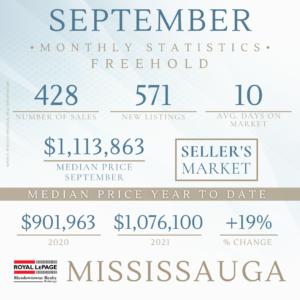
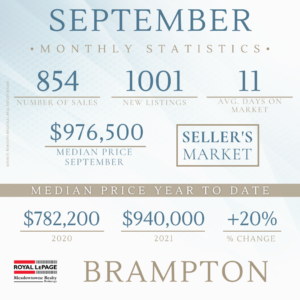
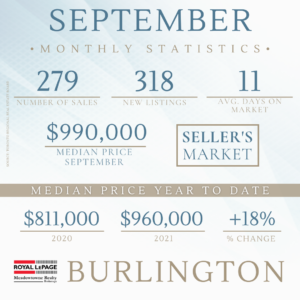
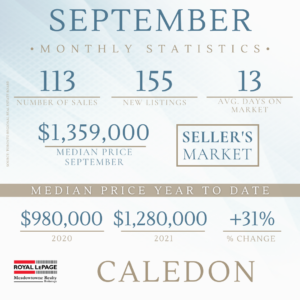
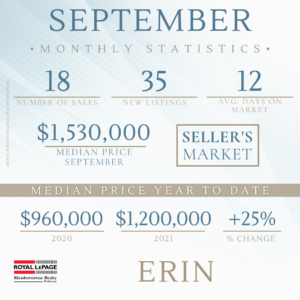
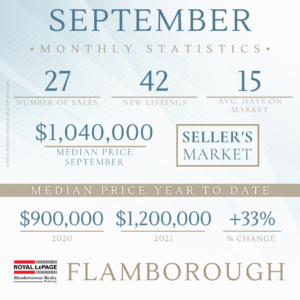
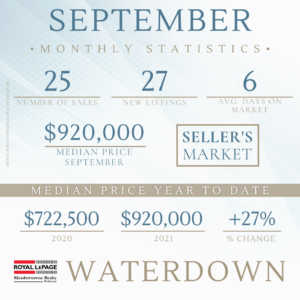
Meanwhile here in Mississauga, it’s a sellers market. Both for Condo Apartments and Freehold home types. Investors are active in the market looking for residential homes to purchase and rent out. At the same time families are actively searching for homes to live in. Further as we can see from the charts below, it’s good for sellers in all the markets surrounding Mississauga. In short Mississauga homes for sale are in high demand.
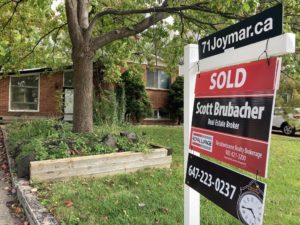 So a short story about my most recent sale at 71Joymar Drive in Mississauga. Our strategy was to post a “coming soon sign” while we decluttered the home, cleanup the yard and got things ready for MLS. In so much as we held offer’s for five days, the home sold 34% over asking. The happy buyer will be building a new home to live in.
Mississauga House Prices reported in October 2021
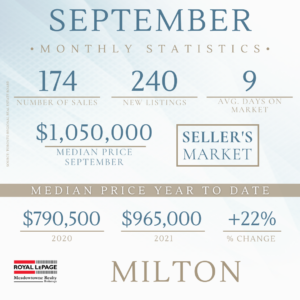
Avg. house price Mississauga Toronto Milton
(All home types) $ 1,037,972 $1,090,196 $1,128,493
All House Types in Mississauga Average Prices
Detached $1,778,928
Semi-Detached $1,032,111
Condo TH $790,133
Condo Apt $589,780
Link $1,048,000
Freehold TH $1,032,179
Total Average $1,037,972
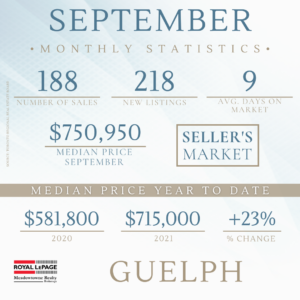
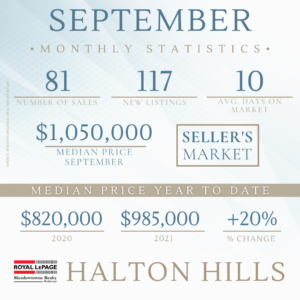
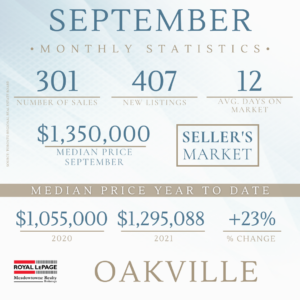
Mississauga House Price Report October 2021
Our next Boomers on the Move is coming up on November 17th, so be sure to tune in for some great information.